- →INP is the worst interaction latency of a visit, not an average: one badly built modal or filter can sink a page whose other interactions are instant.
- →Split every INP number into input delay, processing time and presentation delay before touching code, because the fix for a blocked main thread has nothing in common with the fix for a 4000 node re-render.
- →Total Blocking Time is a poor stand-in for INP: DebugBear documented Discord passing CrUX INP at 81 ms with more than 3 seconds of TBT, so never sign off an optimisation on a Lighthouse score alone.
- →Mobile INP is improving on its own: the 2025 Web Almanac reports 77 % of mobile pages with good INP against 74 % in 2024, while only 48 % of mobile pages pass all three Core Web Vitals, which means LCP usually deserves the first sprint.
- →None of the December 2025, March 2026 or May 2026 core updates came with INP-specific guidance; presenting a ranking drop as an INP problem without controlled before/after data is guesswork sold as analysis.
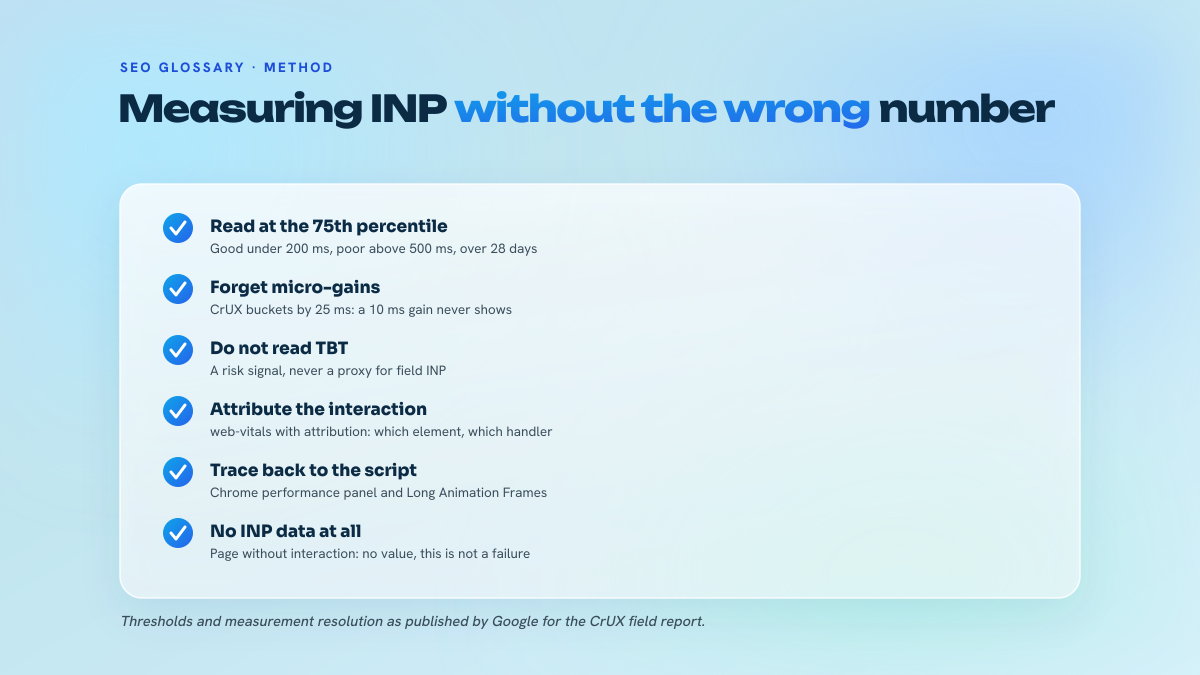
- →CrUX moves on a 28 day rolling window with 25 ms granularity, so plan a month of patience between shipping a fix and reading the field verdict.
What INP actually measures
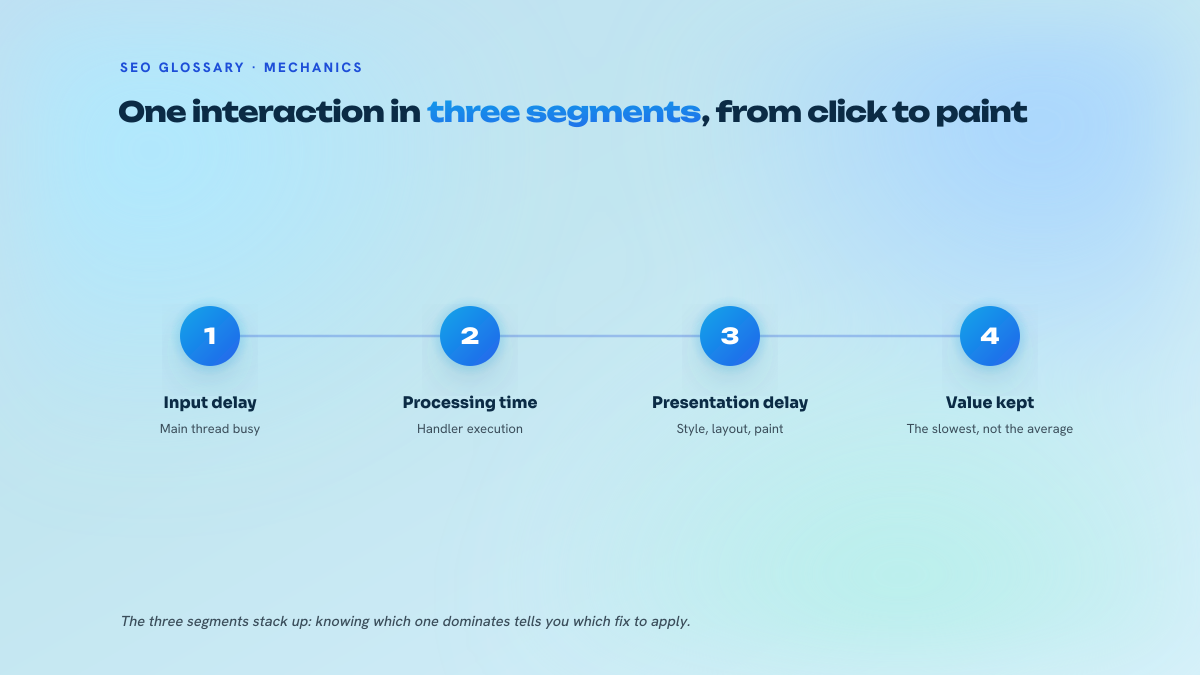
INP is a field metric, not a lab score. It watches every click, tap and key press during a page visit, times how long the browser takes to render the next frame after each one, and keeps the worst. Pages with heavy usage get a small allowance: one interaction is discarded for every 50 recorded, which makes the value behave like a high percentile rather than a raw maximum. Scrolling and hovering are excluded, so a page can feel perfectly smooth to scroll and still report a poor score.
The number decomposes into three phases, and identifying the dominant one is most of the diagnosis. Input delay is the time between the user action and the moment your handler starts, usually spent waiting for the main thread to finish something else. Processing time is your own JavaScript running. Presentation delay covers everything between the handler returning and the pixels changing: style recalculation, layout, paint, compositing. A single page application that re-renders a four thousand node list on a filter click shows a fat processing time. A page where the click lands while a third party tag is parsing shows a fat input delay for the exact same visible symptom, and the two call for opposite fixes.
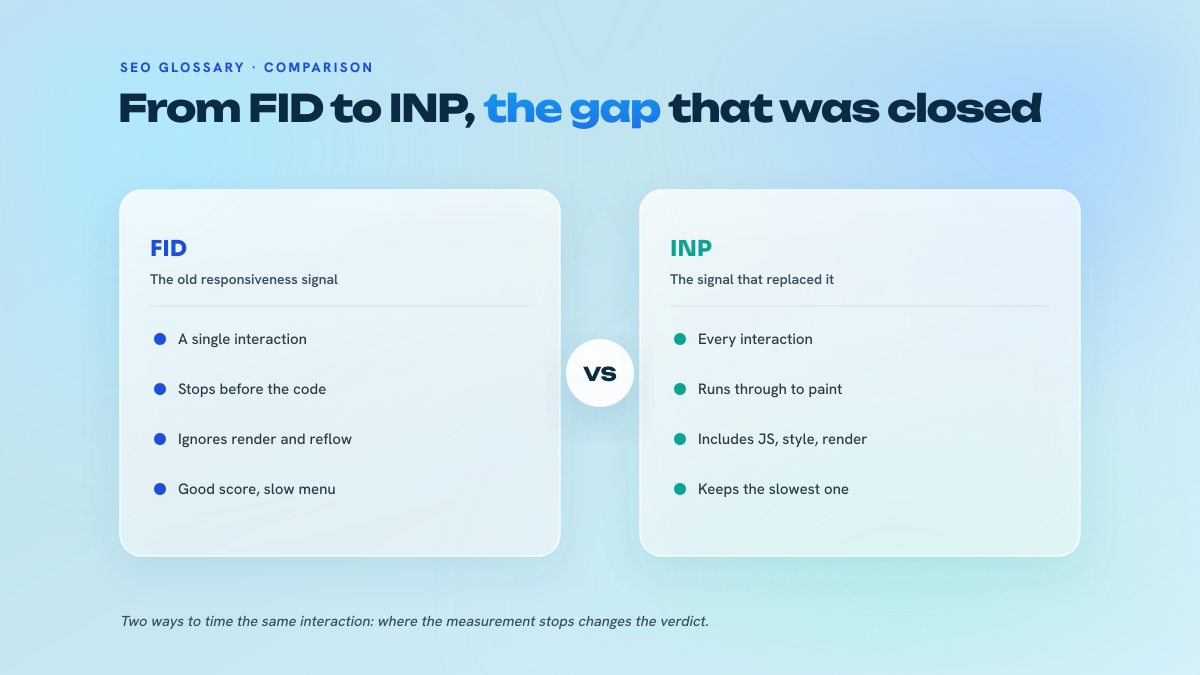
The thresholds are 200 ms or less at the 75th percentile of visits for good, above 500 ms for poor, with the middle band being where teams waste the most meeting time. INP took over from FID because FID only timed the input delay of the first interaction on the page, which let a site pass comfortably while every subsequent click cost half a second. FID scored the doorway, INP scores the whole visit, and that change alone exposed a generation of interfaces that had been optimising the wrong frame.
The Chrome team walks through the metric and what it means for responsiveness here:
How it is measured in 2026: field, lab, and the gap between them
The authoritative source is CrUX, the Chrome User Experience Report, surfaced in PageSpeed Insights and in the Core Web Vitals report of Search Console for sites with enough traffic. CrUX aggregates real Chrome visits over a 28 day rolling window and, as DebugBear points out in its 2025 global analysis, stores INP with 25 ms granularity, so a change of a few milliseconds is invisible by construction. That same analysis puts typical INP around 75 ms in South Korea and around 100 ms in the United States, Germany and Japan, a reminder that device mix and country make cross-site comparisons meaningless unless you segment.
For anything finer, you need your own RUM. The web-vitals library exposes an onINP callback, and its attribution build hands you the interaction target selector, the phase breakdown and, since Long Animation Frames landed, the script that actually blocked the frame. That last piece is what turns a metric into a ticket: instead of knowing that a page scores 480 ms, you know that a consent script kept the main thread busy for 300 ms on the first tap. Building this yourself over the Event Timing API is a half day of work and it is worth doing, because CrUX gives you a verdict without a cause.
Browser coverage widened at the end of 2025: web.dev reported on 16 December 2025 that INP and LCP reached Baseline Newly available after Safari 26.2 shipped the required APIs. CrUX itself remains Chrome only, so cross-browser measurement still depends on your own RUM, but the API is no longer a Chrome dialect.
Lab measurement is the part where most audits go wrong. Lighthouse cannot produce an INP score from a passive page load, since there is no interaction to time, so it reports Total Blocking Time and everyone treats it as a proxy. It is a bad one. DebugBear published a demo set where only 4 of 22 desktop URLs reached a synthetic INP of 150 ms or less while 15 of 22 had good CrUX INP under 200 ms, and cited Discord as an extreme case: more than 3 seconds of TBT, 81 ms of CrUX INP. Long tasks during load do not necessarily overlap with the moments users click. Note too that PageSpeed Insights moved to Lighthouse 13.0 on 20 October 2025 per Google's release notes, and that audit identifiers get renamed or removed between versions, so any dashboard parsing the PSI API should fail loudly rather than silently reporting zeros.
This conference talk goes deeper into how the metric is computed and why long tasks and pointer events interact the way they do:
Where INP matters in an SEO operation, and where it does not
INP is part of the Core Web Vitals set used by Google ranking systems, and Google keeps repeating the caveat that good scores do not guarantee prominent positions: relevance, quality, authority and links stay necessary. Take that at face value. None of the December 2025 core update, the March 2026 core update or the May 2026 one shipped INP-specific guidance. The volatility figures that circulated around March, including the SE Ranking data on top-three URLs changing position, describe overall ranking churn, not an INP effect, and quoting them as proof that responsiveness moved the needle is the kind of correlation that gets a technical sprint funded for the wrong reason.
Prioritisation should follow the population data. The 2025 Web Almanac, built on CrUX measurements from June and July 2025, reports 77 % of mobile pages with good INP against 74 % in 2024, 97 % on desktop, and a jump from 53 % to 63 % among the top 1000 sites. On mobile, 62 % passed LCP, 77 % passed INP, 81 % passed CLS, and only 48 % passed all three. Read plainly: for most sites, loading speed is the harder gate, and layout stability or server response time often buy more than a hunt for a stray event handler. INP earns the first slot when your interface is interaction-heavy: faceted commerce, configurators, search-as-you-type, anything where the click is the product.
There is a second reason to care that has nothing to do with the ranking systems, and it is the one we act on when we build media. A page whose filter freezes for half a second loses readers before they reach the paragraph that carries the editorial link, which makes responsiveness a quality criterion for a host page, not just for a landing page. Across the French editorial media we run in-house, interaction latency is part of what we check before a site enters the catalogue anyone can browse without an account, alongside traffic and topical fit. If you are arbitraging a quarter between a performance sprint and editorial acquisition, our public rate card gives you the other side of that trade-off in euros rather than milliseconds.
Debugging INP in production
Start from field data, always. Pull the URL groups with poor INP from CrUX or Search Console, then look at your RUM attribution to get the interaction target and the phase split for those specific pages. Only then open the Performance panel in Chrome DevTools, throttle the CPU by four or six times to approximate a mid-range Android, and reproduce the interaction while recording. The interactions track shows the three phases directly, and the long tasks flame chart tells you which script owns the delay. Skipping the field step means you end up profiling the interaction you find annoying rather than the one your users actually hit.
The usual culprits are boringly consistent. Hydration of a heavy component tree costs input delay on early clicks. State updates that re-render a whole list instead of a row cost processing time. Analytics and consent scripts fire synchronously inside click handlers. Reading an element geometry after mutating the DOM forces a synchronous layout inside the handler. Non-passive touch listeners block the compositor. On the presentation side, an oversized DOM makes every style recalculation expensive regardless of how tight your JavaScript is.
The fixes follow from the phase. When processing time dominates, yield to the main thread inside the handler with scheduler.yield, or split the work so the visible feedback paints first and the rest continues after, which is exactly what startTransition does in React and what a deferred update does in Vue. Push non-urgent work behind requestIdleCallback. When input delay dominates, the problem is upstream: defer third party tags, break up the long tasks that run during and just after load, and stop scheduling work on a timer that lands mid-visit. When presentation delay dominates, shrink the DOM affected by the update, use content-visibility on offscreen sections, and let the browser handle disclosure widgets and dialogs natively instead of re-implementing them in JavaScript.
The Chrome for Developers deep dive covers the advanced patterns, including yielding strategies and framework-level traps:
What we see go wrong
The most expensive mistake is optimising Total Blocking Time and declaring INP fixed. TBT measures the load phase, INP measures the interactions, and the DebugBear numbers above show how far apart the two can sit. A team can spend three weeks shaving bundle size, watch the Lighthouse score climb, and see CrUX INP move by nothing at all.
Second, reading the median instead of the 75th percentile. INP is scored at p75 across visits, and a median of 120 ms on a page with a p75 of 380 ms describes a site that works fine for people on recent phones and fails for everyone else. Same trap in reverse when the dev machine is a laptop with sixteen cores and a fibre connection: the metric was designed around the devices your dev team does not own.
Third, impatience. CrUX aggregates 28 days and rounds to 25 ms, so a fix shipped on Monday will not show up in PageSpeed Insights on Friday. Teams roll back working changes because the field number did not move, and then rediscover the same fix six months later. Keep your own RUM running so you have a same-day signal, and treat CrUX as the confirmation.
Fourth, forgetting that INP keeps the worst interaction. Ninety-nine excellent interactions and one modal that takes 600 ms to open give a poor score, which is why a page-level average of your handler timings tells you nothing. Hunt the tail, not the mean.
Last, the framing problem. Justifying a performance budget with a promise of ranking gains sets up a disappointment, because Google's own position is that passing Core Web Vitals does not guarantee anything, and the population data says most sites lose more traffic to LCP than to INP. Argue INP on what it actually delivers: users who complete the interaction instead of bouncing off a frozen interface, which is a conversion argument and a content consumption argument well before it is a ranking one.
Nautilinks operates an owned network of editorial media. In-house written articles, transparency disclosures respected, anchor mix calibrated.
Frequently asked questions
What counts as a good INP score, and at which percentile is it judged?
200 ms or less at the 75th percentile of page visits is good, above 500 ms is poor, and the range between the two is flagged as needing improvement. The percentile matters as much as the threshold: a comfortable median means nothing if a quarter of your visits sit above 200 ms. Google evaluates it on field data over a 28 day rolling window, per origin and per URL group when volume allows.
Why does Lighthouse show a terrible Total Blocking Time while my CrUX INP is fine?
TBT measures main thread blocking during page load, INP measures the frames rendered after real user interactions, and the two rarely overlap. DebugBear documented Discord with more than 3 seconds of TBT and an 81 ms CrUX INP. If your long tasks run before users start clicking, TBT punishes you and INP does not. Fix TBT for load metrics, but never sign off an INP optimisation on a lab proxy.
How do I find which element is responsible for a bad INP without guessing?
Use the attribution build of the web-vitals library and log the onINP payload to your own endpoint. It returns the interaction target selector, the split between input delay, processing time and presentation delay, and with Long Animation Frames data, the script that occupied the main thread. That gives you a page plus element plus phase triple. Only then reproduce it in the DevTools Performance panel with CPU throttling to confirm the cause.
Should INP come before LCP in a technical roadmap?
Usually not. The 2025 Web Almanac reports 77 % of mobile pages passing INP against 62 % passing LCP, with only 48 % passing all three Core Web Vitals. For a typical content site, loading speed is the harder gate. INP jumps the queue when the interface is interaction-heavy: faceted commerce, configurators, instant search, any product where the click is the experience rather than a step toward it.
Did the recent core updates change how much INP weighs in rankings?
There is no verified Google announcement to that effect. The December 2025, March 2026 and May 2026 core updates shipped without INP-specific guidance, and Google keeps stating that good Core Web Vitals do not guarantee prominent rankings. The ranking volatility figures published around March 2026 describe overall churn. Attributing a position loss to INP without controlled before and after data on content, links, intent and device mix is speculation.
How long before a deployed fix shows in PageSpeed Insights?
Plan for roughly a month. CrUX aggregates a 28 day rolling window, so a fix shipped today is diluted with four weeks of old visits before the reported value settles, and its 25 ms granularity hides small gains entirely. Run your own RUM if you need a same-day signal on whether the change worked, and use CrUX only as the confirmation that Google sees what you see.
Test your knowledge
Quiz: Interaction to Next Paint (INP)
1/3A page records 120 interactions during a visit. How is its INP value derived?