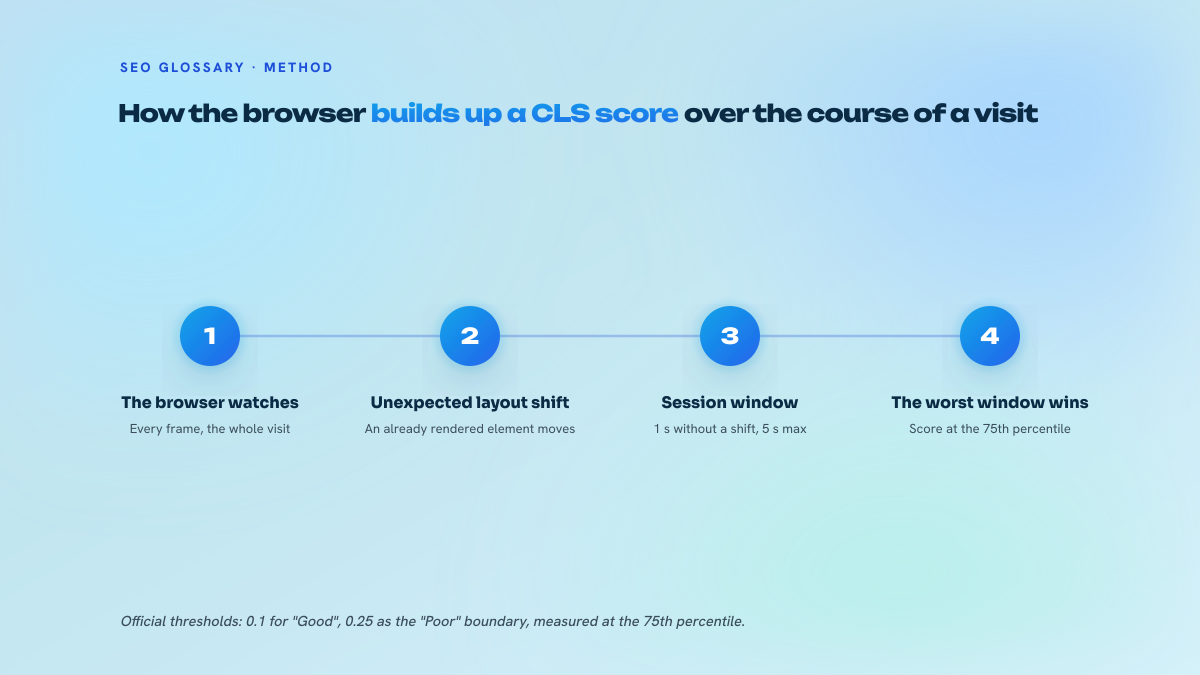
- →CLS reports the worst session window, not the sum of every shift over the page's life: a window closes one second after the last shift and is capped at five seconds, so long reads and infinite scroll do not accumulate.
- →Per the 2025 Web Almanac (published 15 January 2026), 81% of mobile loads already sit in the good band for CLS against 62% for LCP: layout stability is the metric the web has largely solved, LCP is the bottleneck.
- →No core update in the last twelve months was attributed to Core Web Vitals in Google's Search Status Dashboard, so treat any 2026 claim about a stricter CLS penalty as unsupported.
- →A host media above 0.25 on its article template is telling you it injects ad slots and modules after first paint: the paid link stays crawlable, the click-through does not survive the reflow.
- →Lighthouse 13 (PageSpeed Insights, 20 October 2025) renamed the layout-shift audit to cls-culprits-insight without changing scoring, which can fake a regression in any dashboard querying audit ids.
- →Fix at template level with reserved space, not with a performance plugin: a caching layer changes the timing of a shift, never its existence.
What the number actually counts
CLS is neither a duration nor a count of shifts. Each individual layout shift gets a score equal to the impact fraction multiplied by the distance fraction, as defined in the Layout Instability spec: the impact fraction is the share of the viewport covered by the union of an unstable element's before and after positions, the distance fraction is the greatest distance any unstable element travelled divided by the viewport's largest dimension. A promo bar that pushes half the visible area down by a fifth of the screen height scores 0.5 x 0.2 = 0.1, and that single event eats the entire « good » budget.
The cumulative part is where most explainers are still five years out of date. Since the 2021 revision, Chrome does not add up every shift for the lifetime of the page. It groups them into session windows: a window opens on the first shift, closes one second after the last one, and is capped at five seconds. The reported CLS is the score of the worst window, not the grand total. That distinction is the difference between a news site with infinite scroll being unrankable and being perfectly fine, because a hundred small shifts spread over a ten minute read do not stack.
Shifts that happen within 500 milliseconds of a user interaction carry the hadRecentInput flag and are excluded. Opening an accordion, expanding a filter panel, dismissing a banner by clicking it: none of that counts. This is a deliberate carve-out for expected motion, and it is also the reason a page can feel jumpy to a human and still report a clean score. The metric measures unexpected instability, not all instability.
Two consequences follow for anyone auditing pages at scale. A CLS of 0 does not certify a stable page, it certifies that nothing moved unexpectedly during the loads that were sampled. And a bad CLS is almost always one event rather than a general malaise, which makes it one of the few web performance problems with a single identifiable culprit.
Thresholds, field data and what changed in the toolchain
The bar has not moved: 0.1 or below is « good », up to 0.25 is « needs improvement », above that is « poor », assessed at the 75th percentile of page loads, segmented by device, over a 28 day rolling window in CrUX. It sits next to LCP at 2.5 seconds and INP at 200 milliseconds inside the three metrics Google groups under page experience. Nothing there changed in the past year, and the claim doing the rounds that a 2026 core update introduced stricter layout stability scoring has no basis: Google's Search Status Dashboard lists the March 2026 and May 2026 core updates with no mention of Core Web Vitals, and the May 2026 announcement states only that the rollout started and completed.
The field data is the part worth internalising, because it reframes the priority question. The 2025 Web Almanac performance chapter, published 15 January 2026 on HTTP Archive and CrUX data collected mainly in July 2025, puts 81% of mobile page loads in the good band for CLS and 72% on desktop. Good mobile CLS climbed from 62% in 2021 to 81% in 2025, gaining only 2 percentage points over the previous year. In the same dataset, 48% of mobile pages and 56% of desktop pages pass all three thresholds, with mobile pass rates of 62% for LCP, 77% for INP and 81% for CLS.
Read that the right way: layout stability is the metric the web has largely solved, and LCP is what keeps sites out of the passing bucket. If you are handed a performance budget and a quarter of engineering time, spending it on CLS when yours already reads 0.06 is misallocation. The Almanac also puts homepages slightly behind secondary pages, 79% versus 81% good on mobile, which matches what we see in audits: hero carousels, promo modules and above-the-fold ad units concentrate on the one template nobody audits.
The toolchain did move. PageSpeed Insights and its API switched to Lighthouse 13.0 on 20 October 2025, and Lighthouse 13 reorganised legacy audits into insight groups, the old layout shift audit becoming cls-culprits-insight (Search Engine Journal). Scoring was untouched, but any dashboard querying Lighthouse audit ids directly broke quietly, and a month over month agency report can now show a change that never happened on the site. Check that before you present a regression to a client.
For single page applications, Chrome's Soft Navigations API remains the open question. A final origin trial was announced on 20 April 2026 for Chrome 147 to 149, attaching a navigationId to performance entries including layout-shift, which would finally let you attribute a shift to a specific view in an app-like flow. Google says how soft navigation data will feed CrUX is still undecided, so treat it as measurement research and keep instrumenting hard navigations. If your stack already does server rendering with client hydration, hydration mismatches cause far more shifts than route changes anyway.
Where CLS matters in a netlinking operation
The honest answer first: a layout shift does not change the value of a link. Googlebot parses the DOM, position in the rendered document is what gets weighted, and content that arrives late but arrives in the HTML is treated the same whether it jumped or not. Anyone selling you a placement on the argument that the host's Core Web Vitals lift the equity you receive is inventing a mechanism.
What the score does tell you is how the host site is built and monetised, and that is genuinely useful when vetting media before buying. An article template sitting above 0.25 in CrUX is almost never a font problem. It is an ad stack injecting slots after first paint, a related-posts module rendered client side, a newsletter overlay, or three of those at once. That same template will carry your paid paragraph inside a page the reader is fighting. The link stays crawlable, its click-through does not survive the experience, and the referral traffic you quietly hoped for never shows up.
This is one reason we build rather than broker. Across the French editorial media we run in-house, layout stability is a build decision made once in the template and inherited by every article, because there is no third party ad script to reflow around. You can verify the field data of any host yourself before ordering, which is the whole point of publishing the media catalogue and its metrics in the open instead of sending a PDF after a sales call. Run the URL through PageSpeed Insights and read the field section, not the lab score.
The reverse check matters too. If you host sponsored content yourself, a template pushing 0.3 on article pages degrades every placement you sell, and against what a month of link acquisition costs it is the cheapest thing in the whole stack to repair.
What we see go wrong
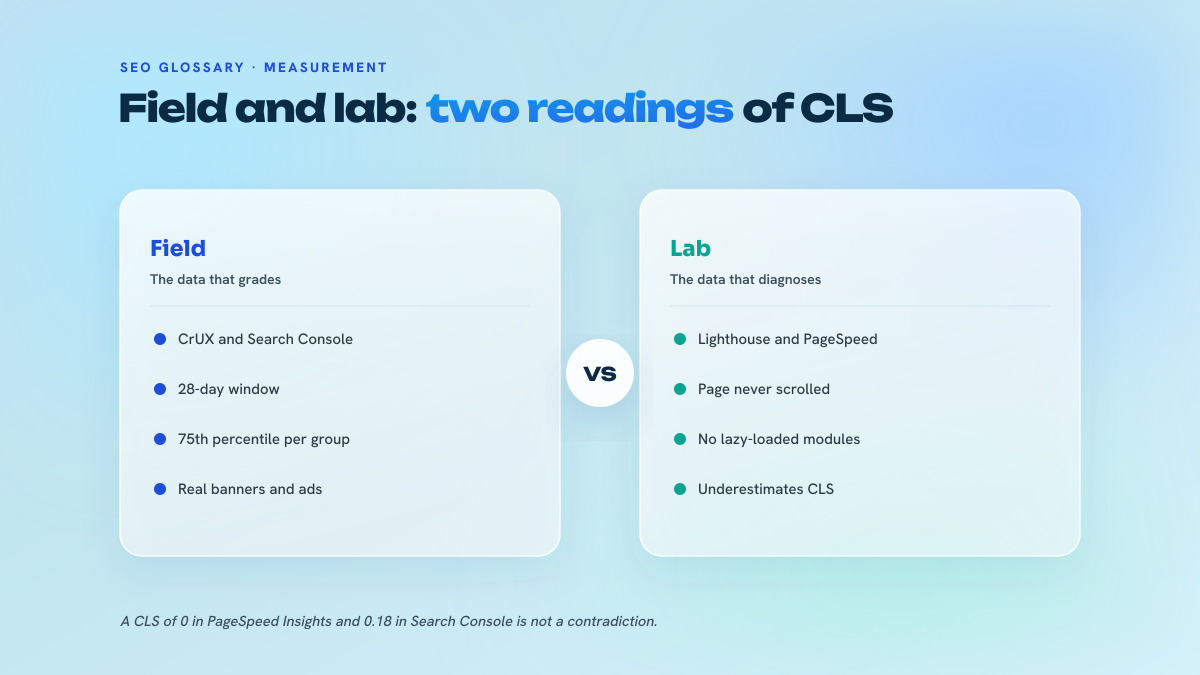
Lab-only validation is the number one failure. Lighthouse runs a cold scripted load with no consent choice made, often with ad scripts blocked or timing out, and no personalisation layer active. A page can report 0 in Lighthouse and 0.31 in CrUX because real users get a cookie banner, an A/B variant, a logged-in header and a lazy-loaded ad rail that the lab run never triggered. Field data decides, lab data explains. Reversing that order wastes weeks.
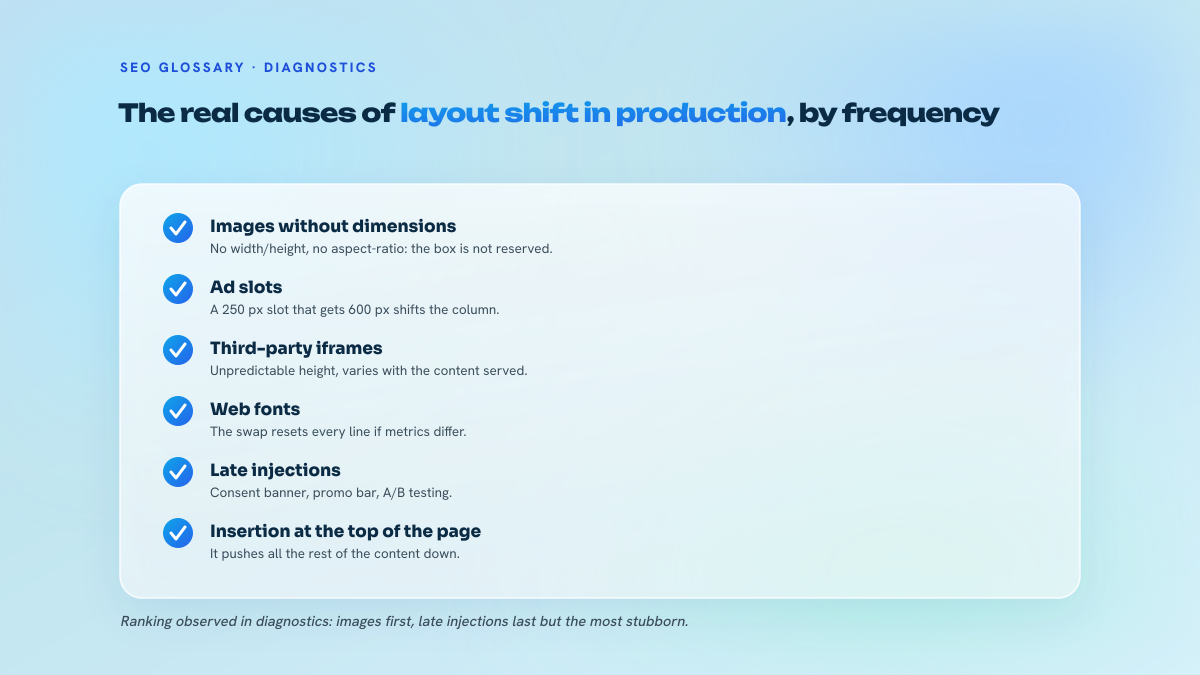
Then the recurring culprits. Images without explicit width and height, still the most common one in 2026, usually because a lazy-load plugin or an image CDN rewrote the markup and dropped attributes the theme had set correctly. Ad and embed slots with no reserved height, where the container collapses until the creative arrives then expands by whatever the network served. Web fonts swapping from a fallback with different metrics, which moves every line of the article body at once and produces a large impact fraction across the full viewport. Content injected by a tag manager, a personalisation script or a consent vendor, the hardest to trace because it does not exist in your codebase. And sticky headers or promo bars mounted after hydration.
WordPress deserves its own note because the pattern is specific. The theme is rarely the problem, the plugin stack is. Lazy-load plugins stripping dimensions, related-posts and recommendation widgets rendering after DOMContentLoaded, sliders initialising on window load, cookie plugins that push a top bar instead of overlaying it, page builders hydrating rows client side. The fix is almost never another performance plugin: it is identifying which plugin writes to the DOM after first paint and giving each insertion point a reserved box in CSS. Adding caching on top of an unstable template changes the timing of the shift, not its existence.
The last mistake is optimising the measurable metric rather than the limiting one. Teams take CLS from 0.14 to 0.04, publish the win, and leave an LCP at 4.2 seconds untouched. Given the pass rates in the Web Almanac data, that is the wrong trade almost every time.
Tactical notes for a working SEO
Start from field data at the 75th percentile, per device, from the Core Web Vitals report in Search Console or from CrUX directly, and only then open PageSpeed Insights on a URL the field data flagged. Lab numbers are for diagnosis, never for reporting.
Instrument production instead of guessing. The web-vitals JavaScript library ships an attribution build that returns the largest shift source for each CLS entry, including the element selector and the time of the shift. Piping that into your analytics with the page template as a dimension turns a vague site-wide score into a ranked list of template defects, and it is the only method that reliably catches the consent banner and personalisation cases.
On the fixes: set width and height on every image and let CSS aspect-ratio hold the box, give ad and embed containers a min-height matched to the most common creative size, declare fallback fonts with size-adjust and ascent-override so the swap does not move text, and mount anything injected after load into a container that already occupies its final space. Reserve, do not react.
Audit at template level, not URL level. Crawl with a tool that captures rendered pages, group by template, sample two or three URLs per group. One bad module in the article layout is a single fix across ten thousand pages. Chasing a perfect zero, on the other hand, is not worth the engineering: 0.05 and 0.00 are the same page to Google and to your reader.
Then put a regression guard in the deploy pipeline. Most layout damage arrives with a new tag, a new consent vendor or a redesigned sidebar rather than with the original build, and it goes unnoticed until a CrUX window rolls over 28 days later.
Nautilinks operates an owned network of editorial media. In-house written articles, transparency disclosures respected, anchor mix calibrated.
Frequently asked questions
Is 0.1 the real bar, or can I live at 0.2 without consequences?
0.1 is the good threshold, 0.25 the poor line, and both are read at the 75th percentile of loads per device. Sitting at 0.2 means a quarter of your visitors experience worse than that, which is a conversion and read-through problem before it is anything else. There is no published evidence of a ranking gap between 0.1 and 0.2, so treat it as a UX budget rather than a ranking target, and spend the engineering elsewhere if your LCP is failing.
Why does Lighthouse show me 0 while Search Console flags the URL?
Lighthouse runs a cold scripted load with no consent decision, frequently without the ad stack, and with no personalisation or A/B script active. CrUX aggregates real sessions over 28 days, banners, logged-in headers and all. The gap is almost always a consent bar, a late-mounting ad rail or an experiment variant. Reproduce it by loading the page in an incognito profile, accepting the banner, and watching the layout-shift entries in DevTools rather than trusting the score.
What actually fixes CLS fastest on a WordPress build?
Find which plugin writes to the DOM after first paint, in this order: the lazy-load or image CDN plugin stripping width and height, the related-posts or recommendation widget, the slider initialising on window load, and the cookie plugin pushing a top bar instead of overlaying it. Give each insertion point a reserved height in CSS and restore image dimensions. Installing a caching plugin on top shifts the timing of the jump without removing it.
Does improving CLS produce a measurable ranking gain?
Not one you can isolate. Google's Search Status Dashboard attributes none of the core or spam updates from August 2025 to June 2026 to Core Web Vitals, and the 2025 Web Almanac shows 81% of mobile loads already passing CLS, so there is little differentiation left to extract. The defensible case for fixing it is user behaviour and conversion reliability. If you need a ranking lever from performance work, LCP at a 62% mobile pass rate is the one with room.
How do I measure CLS properly on a single page application?
Today you cannot attribute it cleanly per view. Chrome's Soft Navigations API, whose final origin trial was announced on 20 April 2026 for Chrome 147 to 149, adds a navigationId to layout-shift entries so soft navigations can be measured separately, but Google states its use in CrUX is undecided. Until that settles, instrument hard navigations with the web-vitals attribution build and log the shift source with your route as a dimension, then treat per-route numbers as internal signal only.
Should CLS be part of how I qualify a site before buying a link on it?
As a signal about the template, yes. A CrUX CLS above 0.25 on article URLs usually means ad slots and modules injected after first paint, which is a decent proxy for how heavily the site is monetised and how much competition your paragraph will have on screen. It says nothing about the link's crawlability or the equity passed. Use it alongside the outbound link profile of the template, not as a scoring criterion on its own.
Test your knowledge
Quiz: Cumulative Layout Shift (CLS)
1/3What value does CLS report for a page view since the 2021 revision of the metric?