- →TTFB is a diagnostic metric, not a Core Web Vital: Google's documentation grades LCP, INP and CLS only, and CrUX classes TTFB as experimental. Anyone selling you a 600 ms « ranking threshold » is inventing it.
- →The working band comes from the 2025 Web Almanac: under 0.8 s good, 0.8 to 1.8 s needs improvement, above 1.8 s poor, always read at the 75th percentile of real users, never on a single lab run.
- →Field TTFB in CrUX bundles redirects, connection setup and CDN cache state, and is only collected on full page loads, so it is not sample-comparable with LCP or INP.
- →Chrome changed responseStart in February 2025 to align with Firefox and Safari on early-hint data, so a site using HTTP 103 Early Hints can post a very low TTFB while the HTML is still being generated.
- →A referring domain's TTFB does not change the PageRank value of its backlink. It changes how reliably that page gets crawled and re-crawled, which is a different and much smaller problem.
- →Fix causes in order: origin compute, then cache strategy, then geography. A CDN in front of an uncached dynamic page moves the wait, it does not remove it.
What TTFB actually measures, and what it hides
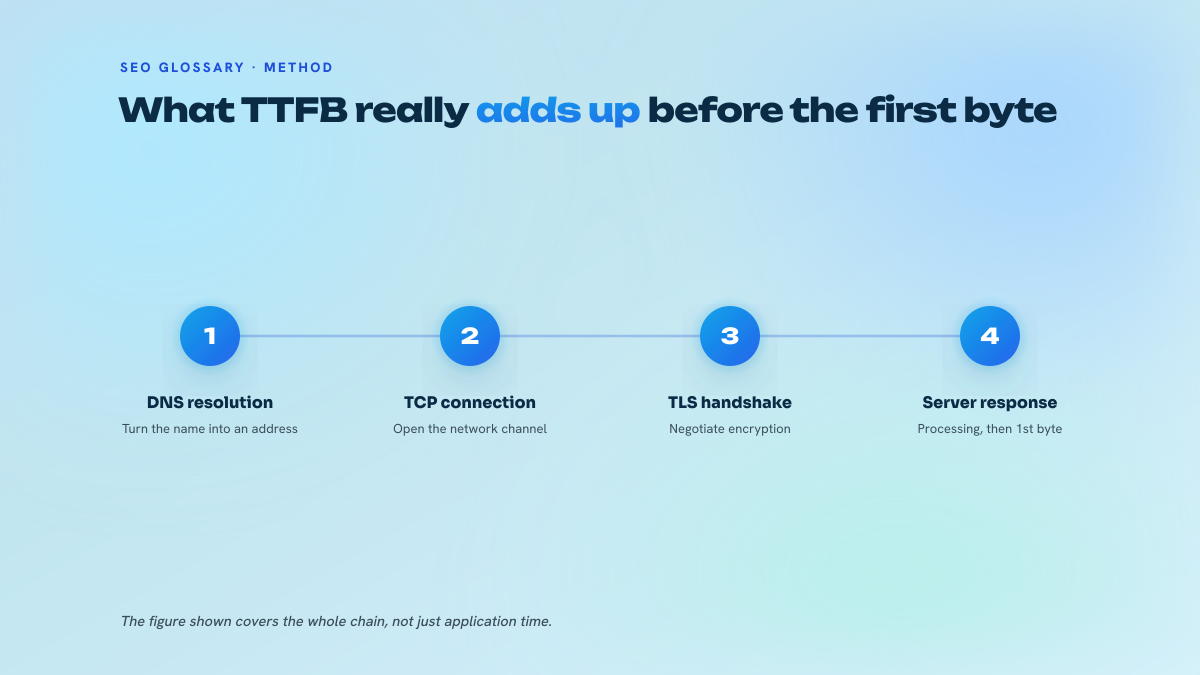
TTFB is one number covering a chain of events: DNS resolution, TCP and TLS handshake, the request travelling to the server, the server building a response, and the first byte of that response arriving in the browser. Time To First Byte is therefore a compound measure, not a server metric. A site hosted on a fast machine in Paris can post a mediocre TTFB in Frankfurt purely because of connection setup and one lazy 301 in the chain.
That compound nature is exactly why the metric is useful as a first probe and dangerous as a KPI. When a page feels slow and you do not yet know why, TTFB tells you in one measurement whether the problem sits before the browser has anything to work with, or after. If the first byte arrives in 180 ms and the page still paints at 3.4 seconds, stop looking at the server: the cost is in render-blocking resources, font loading, or a client-side hydration step. If the first byte arrives at 1.9 seconds, nothing you do in the front end will save the page.
The distinction the top results usually blur is between the standard TTFB reported by performance.getEntriesByType('navigation')[0].responseStart and the wall-clock wait a user experiences. Chrome changed its responseStart behaviour in February 2025, aligning with Firefox and Safari by counting early-hint response data, as documented in DebugBear's 2025 web performance review. A site serving HTTP 103 Early Hints can now report a very low TTFB while the HTML is still being generated. The first byte arrived, the useful bytes did not. Read a suspiciously good number with that in mind, and check whether your historical series predates the change.
The 800 ms line and what the 2025 field data says
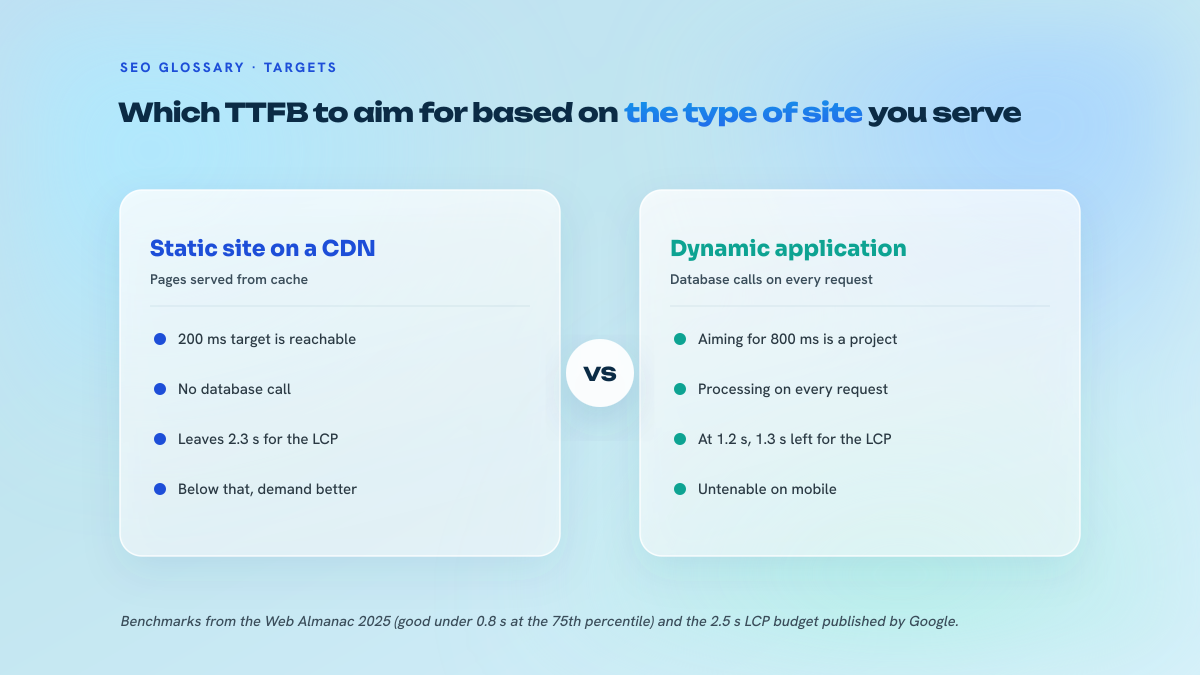
The threshold everyone quotes is 800 ms, and it holds. The 2025 Web Almanac categorises TTFB as good under 0.8 seconds, needs improvement between 0.8 and 1.8 seconds, and poor above 1.8 seconds. These are diagnostic bands published by HTTP Archive, not Google ranking cut-offs, and the difference is not pedantry: one is a triage tool, the other would be a promise to a client you cannot keep.
Google's own position has not moved. Search Central lists LCP, INP and CLS as the Core Web Vitals, with targets of 2.5 seconds, 200 ms and 0.1 respectively. TTFB appears nowhere in that set. Chrome's CrUX methodology documentation classes it as an experimental and diagnostic metric, useful for isolating server and connection delay, explicitly not part of the pass or fail assessment. If you have read a 2026 blog post announcing a fourth Core Web Vital or a 600 ms TTFB ranking threshold, no Google announcement supports it. The confirmed 2025 broad updates, March, June, the August spam update and the December core update that ran from 11 to 29 December according to Search Engine Land, were all described as relevance and quality updates. None of them mentioned server response time.
The field data is more interesting than the threshold. The Web Almanac's July 2025 HTTP Archive and CrUX analysis put the share of sites in the good band at 55 % on desktop and 44 % on mobile, against 54 % and 42 % a year earlier. One point of progress on desktop, two on mobile, across millions of page loads. Compare that with the overall Core Web Vitals pass rate in the same report, 56 % on desktop and 48 % on mobile, and the picture is clear: server response time is the part of web performance that has barely improved, while the rendering metrics have absorbed most of the industry's attention. The mobile gap is structural, not a measurement artefact, and it is where the remaining wins are.
Measuring TTFB without fooling yourself
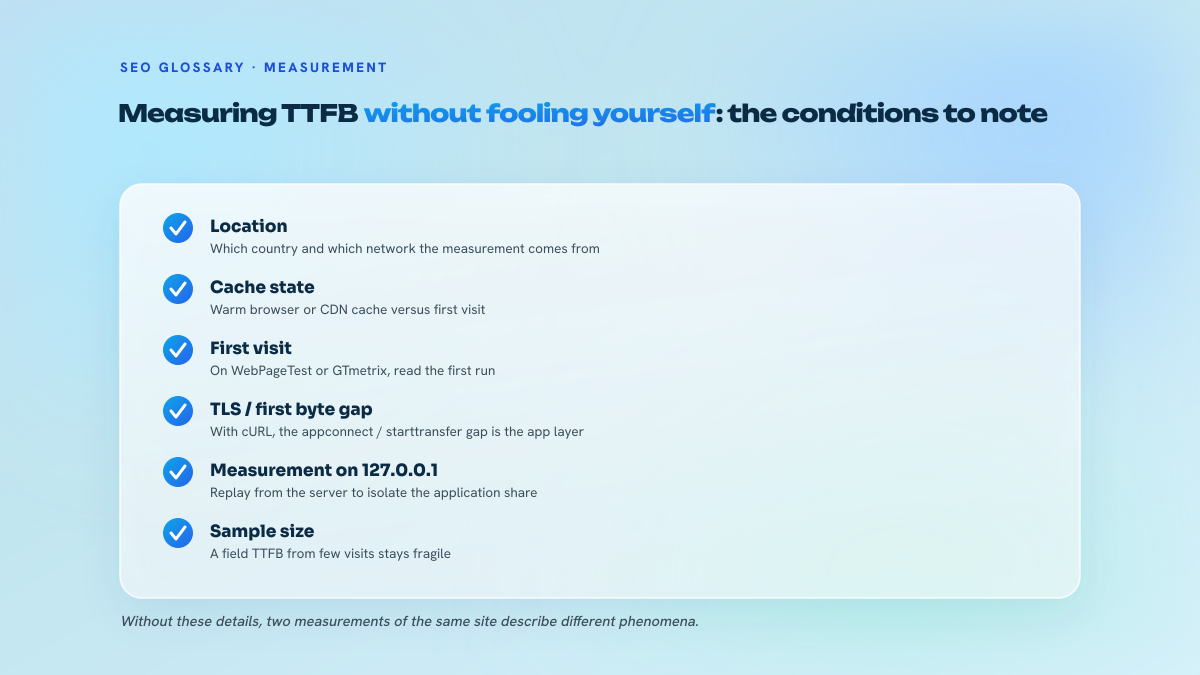
There are two families of measurement and they answer different questions. Lab tools, Lighthouse, WebPageTest, Pingdom, the Chrome DevTools network panel, give you a controlled single request from a chosen location on a chosen connection profile. They are reproducible, which makes them the right instrument for before and after work on a fix. They are also a single sample from one machine, which makes them worthless as a statement about what your users experience.
Field data answers the second question. CrUX aggregates real Chrome navigations, and the number you act on is the 75th percentile, not the median. Two caveats that most guides skip, both from Chrome's CrUX methodology documentation. First, TTFB is collected only on full page loads, while LCP and some other metrics are also collected on back/forward-cache restores and prerendered navigations, so the TTFB sample is smaller and not directly comparable with the others. Second, CrUX TTFB includes connection setup and redirects, and can reflect a response served from a browser cache, a CDN edge or an already-established connection. Comparing your CrUX TTFB against a competitor's without accounting for geography and cache state produces a conclusion, just not a true one.
For diagnosis, the useful move since February 2025 is CrUX's real-user LCP subparts, which split the largest contentful paint into server response time, resource load delay and render delay. DebugBear reports these are exposed through CrUX Visualisation and its own speed test rather than the standard PageSpeed Insights interface. That breakdown ends most arguments about whether a slow page is a hosting problem or a front-end problem in about thirty seconds. DebugBear also added a global TTFB test during 2025, which measures response time from multiple locations and shows whether the response came from a CDN cache. On an international site that single view replaces an afternoon of guesswork, and it is the check to run before blaming a CMS. Its paid tiers start at 125 dollars a month for synthetic monitoring, with RUM from the 325 dollar tier, per the June 2026 pricing listing, so it is a tool you buy for a portfolio of sites rather than for one.
When the number is bad and you need the cause rather than the confirmation, reading raw server logs beats any synthetic run: response times per URL, per user agent, per hour, straight from the origin, with no CDN in the middle to flatter the average.
Where TTFB matters in a netlinking operation
Here is the stance, and it will disappoint anyone selling server-speed audits to link buyers. There is no evidence in Google's published documentation, nor in any confirmed 2025 or 2026 update, that a referring domain's TTFB changes the value passed by its backlink. Link relevance, the surrounding topical context, indexation and the quality of the destination page are separate variables and they are the ones that move rankings. Discounting a placement because the host answers in 1.2 seconds is a rule invented to sound rigorous.
What TTFB does affect on a publisher site is crawl behaviour. Google adapts its request rate to how the server responds, so a host that answers slowly under load gets crawled less aggressively, and a new article on it gets discovered and re-crawled more slowly. On a link placed for the long term that is a delay in the value arriving, not a discount on the value itself. It becomes a real constraint only on large sites where how much crawling the site gets allocated is already the bottleneck.
We apply that logic to the French editorial media we run in-house. Server response time is part of the health check on every site because a magazine that answers in 1.5 seconds indexes its new articles more slowly, and slow indexation is the one thing a link buyer notices. It is not a metric we publish in the catalogue where every media and its traffic are visible without signing up, because it would be dishonest to present it as a quality signal for the link. It is an operational threshold for us, not a selling point.
The other angle worth your time: TTFB on your own money pages, where slow server response delays the largest contentful paint on the exact templates that convert. That is where the metric touches the three field metrics Google actually grades, indirectly but reliably, because LCP cannot begin before the first byte lands.
What we see go wrong
The most frequent mistake is putting a CDN in front of an uncached dynamic page and calling it an optimisation. The edge adds a hop, terminates TLS closer to the user, and then waits on the same slow origin. Latency moves, total wait barely does. A CDN pays off when it can serve HTML from cache, which means solving cacheability first: full-page cache with a sane invalidation strategy, object cache for the expensive database queries, and static rendering wherever the page does not truly need per-request data. Moving a page to rendering on the server with a cached output often does more for TTFB than any hosting upgrade.
Second mistake, optimising a lab number. Someone runs WebPageTest from one location, sees 240 ms, closes the ticket. The 75th percentile in CrUX sits at 1.4 seconds because half the traffic is mobile on degraded connections and a third of it hits a redirect first. Redirects are the silent killer here: every hop adds a full round trip inside the measured TTFB, and a chain of two or three on a canonical mismatch can cost more than the entire server processing time.
Third, treating TTFB as a score to report rather than a symptom to trace. The number tells you where to look, not what is wrong. A 900 ms TTFB caused by a cold cache, an unindexed database query, or a plugin making a synchronous external API call during page generation are three different repairs. Measure the origin processing time separately from the network path before choosing one. And do not average: the average hides the tail, and the tail is where users leave.
Nautilinks operates an owned network of editorial media. In-house written articles, transparency disclosures respected, anchor mix calibrated.
Frequently asked questions
Does a poor TTFB directly cost rankings?
Not as a standalone signal. Google's Core Web Vitals documentation grades LCP, INP and CLS, and Chrome's CrUX methodology treats TTFB as an experimental diagnostic metric. The effect is indirect: server time is spent before the largest contentful paint can start, so a 1.5 second TTFB makes a good LCP arithmetically impossible. Fix it because it caps your rendering metrics, not because a threshold exists.
Which value do I report to a client, the lab one or the field one?
The field one, at the 75th percentile, from CrUX or your own RUM. Lab runs from Lighthouse or WebPageTest are for reproducible before and after comparisons on a specific fix. Reporting a single WebPageTest run as the site's TTFB overstates performance on almost every site with meaningful mobile traffic, because it samples one location, one connection profile and usually a warm cache.
Why is my CrUX TTFB worse than every tool I run?
CrUX includes what your tools exclude: redirects, connection setup, real mobile networks, cold caches, and the geographic spread of your actual audience. It also samples only full page loads, so back/forward-cache navigations that flatter other metrics are absent. Check redirect chains first, then look at the LCP subparts breakdown exposed since February 2025 to isolate real server response time from the network path.
Can Early Hints make TTFB misleading?
Yes, and it is a live reporting issue. Chrome changed responseStart in February 2025 to align with Firefox and Safari on counting early-hint data, per DebugBear's 2025 review. With HTTP 103 Early Hints, the first byte can arrive before the HTML has finished being generated, so TTFB drops while the actual content wait does not. Historical series that cross that date are not comparable.
Should I reject a link placement on a site with a slow server?
No. No Google documentation or confirmed update supports discounting a backlink because the referring domain responds slowly. What a slow host genuinely costs you is crawl frequency, so the article carrying your link gets discovered and refreshed more slowly. Treat it as a delay in when the link starts working, and weigh relevance, topical context and indexation status far above response time.
What is a realistic TTFB target for a content site in 2026?
Under 800 ms at the 75th percentile, following the 2025 Web Almanac bands. That is achievable on any editorial site with full-page caching and a CDN serving cached HTML. Context for calibration: the same report found 55 % of desktop and 44 % of mobile sites in the good band in July 2025, so hitting it on mobile already puts you ahead of most of the web.
Test your knowledge
Quiz: Time To First Byte (TTFB)
1/3How does Google's documentation classify TTFB in 2026?